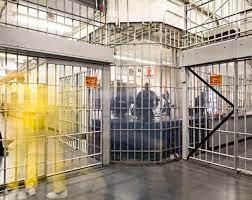
Maryland has an incarceration rate of 531 per 100,000 people (including prisons, jails, immigration detention, and juvenile justice facilities), meaning that it locks up a higher percentage of its people than almost any democracy on earth. Read on to learn more about who is incarcerated in Maryland and why.
36,000 people from Maryland are behind bars
Additionally, the number of people impacted by county and city jails in Maryland is much larger than the graph above would suggest, because people cycle through local jails relatively quickly. Each year, at least 83,000 different people are booked into local jails in Maryland.
Rates of imprisonment have grown dramatically in the last 40 years
Also see these Maryland graphs:
- total numbers rather than rates.
- Women’s prisons: Incarceration Rates | Total Population
- Men’s prisons: Incarceration Rates | Total Population
Today, Maryland’s incarceration rates stand out internationally
In the U.S., incarceration extends beyond prisons and local jails to include other systems of confinement. The U.S. and state incarceration rates in this graph include people held by these other parts of the justice system, so they may be slightly higher than the commonly reported incarceration rates that only include prisons and jails. Details on the data are available in States of Incarceration: The Global Context. We also have a version of this graph focusing on the incarceration of women.
People of color are overrepresented in prisons and jails
See also our detailed graphs about Whites and Blacks in Maryland prisons and jails.
Maryland's criminal justice system is more than just its prisons and jails
Data on COVID-19 in Maryland jails and prisons
We gave Maryland a "D-" grade in September 2021 for its response to the coronavirus in prisons, noting that:
- Maryland is one of only 8 states that have failed to reduce their prison population by more than 10% during the pandemic.
- One of the easiest ways to reduce prison populations — especially during a pandemic — is to suspend admissions to prisons for technical violations of probation and parole (which are not crimes). Yet most states, including Maryland, failed to utilize this simple tool of population reduction.
For more detail, see our report States of Emergency. Or check out these other resources:
- Our Responses to the COVID-19 Pandemic page tracks criminal justice policy responses to the coronavirus all 50 states
- Prisons are COVID-19 hotspots, but as of mid-May 2021, only 47% of people in Maryland prisons had gotten a vaccine
- As of late April 2021, only 50% of corrections staff in Maryland prisons had gotten the COVID-19 vaccine
- How crowded are Maryland prisons, as of December 2020?
- How many COVID-19 cases in Maryland communities can be linked to outbreaks in correctional facilities? (data from our report Mass Incarceration, COVID-19, and Community Spread)
- As of August 2020, Maryland prisons were not even requiring staff to wear masks at work
- Maryland was right to suspend all medical copays in prisons at the beginning of the pandemic. The state should make this change permanent
- State prison and jail population data for February 2022. (Previous data is available for October 2021, June 2021, February 2021, December 2020, September 2020, August 2020, and May 2020.) Data availability varies by state.


